A-B-C-D-E-F-G-H-I-J-K-L-M-N-O-P-Q-R-S-T-U-V-W-X-Y-Z
Annotated Source Listing:
This is the source code listing in a module displayed with line and node numbers - usually shown alongside the module flowgraph. This listing can optionally be of the original source code, or of the preprocessed code if appropriate for the analyzed language.
> Back to Top
Battlemap:
 The main McCabe IQ graphical interface which displays calling diagrams (showing modules), class diagrams and coverage information and allows browsing of metrics reports, flowgraphs and all other McCabe IQ information. McCabe IQ functionality can also be accessed from the CLI command line interface. The main McCabe IQ graphical interface which displays calling diagrams (showing modules), class diagrams and coverage information and allows browsing of metrics reports, flowgraphs and all other McCabe IQ information. McCabe IQ functionality can also be accessed from the CLI command line interface.
> Back to Top
Boolean:
Analysis of the combined outcomes of compound decisions. In some languages (esp. C, C++, Java and Ada) decisions can use more than one predicate which are evaluated in sequence; these are called compound decisions; Boolean analysis is the study of these decisions. Also used as the name for one of the supported McCabe IQ instrumentation architectures which is used to store MC/DC information.
> Back to Top
Branch:
A branch is either the entry point to a module, or an outcome of a decision. An "if" statement has 2 outflow branches which are TRUE and FALSE. A "switch" (also known as case, select or evaluate according to language) has as many branches as there are cases in the switch. In a flowgraph, every edge is part of a branch, with a branch having at least one edge.
> Back to Top
Branchonly:
This describes an instrumentation type which writes trace data that only stores branch coverage information.
> Back to Top
Build:
The process of compiling and linking an application, usually reserved for the compilation and linking of instrumented source code. - The terminology diagram displays the McCabe analysis process.
> Back to Top
Checksum:
A calculation performed on a sequence of characters to yield a single figure, which will differ for every different sequence. Usually reserved for Module Checksums used in McCabe Change.
> Back to Top
Class:
Outside McCabe IQ a class is a framework for creating objects in OO languages. In McCabe IQ for OO languages, the McCabe parsers create IQ classes matching OO classes or data structures. In non-OO languages, the McCabe parsers create IQ classes optionally matching source files and/or user defined collections of modules (which are created and modified using the Class Editor).
> Back to Top
Class Editor:
The tool available in the Battlemap to manage and view classes, including parsed classes in OO languages and user classes created by the user.
> Back to Top
Class View:
The Battlemap can display two diagrams showing different information which are the Functional View and the Class View.
The Class View is accessed using View->Switch to Class View or by pressing CTRL-V in the Battlemap. The Class View will only display a diagram if class information has been encountered for the source code under analysis - usually the case for OO languages or for non-OO languages where user class grouping has been applied. It displays classes as boxes with lines representing relationships between them. Classes are colored green, yellow or red (default colors which can be changed) according to a customizable box coloring scheme.
The lines in the Class View represent relationships between classes, with the displayed relationships being user selectable. The available relationships which can be displayed are Inheritance, Aggregation, Friendship and Usage; different colors and/or symbols can be used for each line type.
> Back to Top
CLI:
McCabe IQ Command Line Interface allowing analysis, metrics report production, the export of instrumented source and most other McCabe IQ functionality available in the Battlemap. Commands are executed in the format "cli verb options" where verb is one of CHART, COMPARE, CROSSREF, EXPORT, GRAPH, IMPORT, LISTING, METRICS, PARSE, PURGE, TESTINGDATA or TESTPATH.
> Back to Top
Compile:
The process of converting source code into object code which can be executed. In some languages and environments, the compiled object code may need to be linked together to create an executable program. The terminology diagram displays the McCabe analysis process.
> Back to Top
Compiled Object:
This is the output from the compilation process. In some languages and environments, (especially C and C++), the compiled object code may need to be linked together to create executable programs or other linked objects (which are in turn linked to create executables etc.).
> Back to Top
Compiled Scope:
The full compilation process in some languages (especially C and C++) involves compilation, linking into linked objects followed by further linking into a final object (which is usually a program, executable or library). Compile Scope is related to the final link process into the final linked object - everything which is (statically) linked into the final linked object is in the same Compiled Scope. Some Linked Objects will execute separately to the code in other Linked Objects or in the Final Object and have their own "Compiled Scope"; this includes dynamically linked objects, dynamic libraries, shared text libraries etc.
> Back to Top
Complexity:
Short name for McCabe Cyclomatic Complexity.
> Back to Top
Config Wizard:
Standard utility for creating and modifying Projects. It is started from the Battlemap using File->New Project to create new projects, or Project->Settings to modify the existing Project. You may also start it outside the Battlemap by running the executable CFGWIZ.EXE (Windows) or cfgwiz (Unix).
Note that the Config Wizard will create a PCF file which uses special parse tags, and that if you open an existing PCF using old style parse tags, they will be converted to the new style.
> Back to Top
Coverage:
Generic term describing the analysis of what has been executed during testing. The testing must be performed on an instrumented application in order to collect trace data. Coverage can be analyzed at different levels, including line, branch, cyclomatic path and frequency analysis.
> Back to Top
Coverage Server:
The Coverage Server extends the functionality of the McCabe testing process by providing a socket-based alternative for the collection of trace data. It is a socket-based, multithreaded server that can accept trace data simultaneously from multiple McCabe instrumented applications, and save trace data in a specified location.
Learn more in McCabe Coverage Server.
> Back to Top
Create Project:
Create a McCabe project (.pcf) using the Config Wizard, make2pcf (make conversion utility) or manually. The terminology diagram displays the McCabe analysis process.
> Back to Top
Custom Metric:
Custom Metrics are external values which can be imported into McCabe IQ. In order to import values, you must first create a new Custom Metric (which defines the collection level, name, description and range for the external values). Custom metrics are created using the Metrics  Create Custom Metrics menu item. Create Custom Metrics menu item.
The external values must then be created in the file "custom.met" located in the Project folder (where the PCF is), which must contain a list of names and values (separated by a space). The names in the custom.met file need to correspond to the elements in the Battlemap into which you want to import the custom metrics. If you have created a module level custom metric, then the names should be the module names in the Battlemap and so on.
Selecting Metrics Import Custom Metrics will then read the custom.met file and import the values into the elements. You can thereafter use the Custom Metric values in Custom Reports and Derived Metrics.
Custom Metrics can be created locally or globally by selecting the "Make Globally Available" option when creating the metric.
> Back to Top
Custom Report:
A Custom report is created by a user. It can report the standard metrics available in McCabe IQ (both static and dynamic metrics), Derived Metrics and Custom Metrics. The report can either be in tabular format or use a graphical representation including Scatterplot, Kiviat diagram or bar chart. A Custom report can also be used to show metrics trend diagrams and information.
Custom reports are created by selecting Metrics Create Custom Reports in the Battlemap (you can create new report or use a standard report supplied in McCabe IQ as a template). Custom Reports can be created locally or globally by selecting the "Make Globally Available" option when creating the report.
> Back to Top
Cyclomatic Complexity:
Cyclomatic complexity (abbreviated as v(G)) is a measure of the complexity of a module's decision structure. It is the number of linearly independent paths and, therefore, the minimum number of paths that should be tested to reasonably guard against errors. A high cyclomatic complexity indicates that the code may be of low quality and difficult to test and maintain. In addition, empirical studies have established a correlation between high cyclomatic complexity and error-prone software.
A set of cyclomatic paths is a linearly independent set of end to end sequences needed to theoretically test a module. The minimum value is always 1.
You can find out more about cyclomatic complexity in the NIST special report.
> Back to Top
Data Dictionary:
The McCabe IQ tool (available using Tools->Data Dictionary in the Battlemap) which allows browsing of data definitions in parsed source code, searching for specific data elements, calculation of data metrics and other data related features. You must be licensed for McCabe IQ to use the Data Dictionary, and you must also ensure that data information is stored when code is parsed (by specifying the "-DATA" parse option in the PCF). You may also use the DVM tool to browse and manipulate data.
> Back to Top
Database:
The information created by McCabe parsers in a Project which drive McCabe IQ. In the form of many files located in the same folder as the .pcf Project File. The terminology diagram displays the McCabe analysis process.
> Back to Top
Depth:
Depth is used to describe the depth of an element within a hierarchy; specifically related to Structure Charts and Class Hierarchies. The Battlemap supports 2 major views which are the Functional View and Class View . You can switch between these views using View->Switch to Class View or View->Switch to Functional View . In the Functional View, depth is the level of a module in the calling hierarchy (the main use of this is to define additional Exclude rules). In the Class View, depth is the level of a class in the inheritance tree.
> Back to Top
Derived Metric:
Derived metrics can be created by a user, calculated using other existing metrics. They can only be created if you are licensed for McCabe QA. The calculation can use logic (including logical IF, AND, OR etc.) and arithmetic. Derived metrics are created using the Quality Derived Metrics menu item.
When creating a Derived Metric, you can either copy an existing Derived Metric or create a new one.
You must select which level ( module, class or program) you want a derived metric to be calculated at, being aware that you can also collect a metric at any higher level and specify what the collection technique will be - minimum, maximum, average or sum (so if you create a module level derived metric, you can collect it at both class and program levels).
Derived Metrics can be created locally or globally by selecting the "Make Globally Available" option when creating the metric.
> Back to Top
Dialect:
A specific implementation of a programming language. You must indicate the correct dialect when creating a new project. If you specify an incorrect dialect this may cause the McCabe parsers to report syntax errors.
> Back to Top
DVM:
The Data Variable Manager available using Tools->Data Variable Manager in the Battlemap. In addition to the Data Dictionary, you can use the DVM to browse and mark data elements. Initially it will display all data elements, and you can search for specific data using a search mask ( Analyze->Select Variables , create masks and use Apply ). You can then browse the located elements (changing the view using options beneath View->Variables ).
Thereafter you can manually confirm individual elements or confirm all which were located by searches (using Analyze->Confirm All Tentative Variables ). Once confirmed, you can save the element list (using File->Save ) for use in a future DVM session, or export the list for use in the Data Dictionary and elsewhere in McCabe IQ (using Data->Export ).
Once you have exported the DVM list, you can access it in the Data Dictionary (using File-> Data References in the Data Dictionary). The data set is also available in other areas of McCabe IQ.
> Back to Top
Dynamic:
Dynamic analysis means the process of parsing source code to create instrumented source, the compilation and linking of the instrumented source, the execution of the instrumented application, the import of trace data and the examination of coverage reports, views and metrics.
Dynamic metrics are those related to coverage.
> Back to Top
Edge:
An edge is a line in a flowgraph; each edge connects 2 nodes. It represents the flow of logic in a module, with a color scheme used to represent the type of flow (cyan edges are used for downward flow, purple edges are for top-test loop exits and yellow lines represent upward flows from the bottom of loops or due to upward jumps).
> Back to Top
Embedded:
This term is used for software applications which run on dedicated hardware (for example mobile phones, consumer electronic components, control systems etc.) as opposed to computer workstations.
> Back to Top
Essential Complexity:
Essential complexity (abbreviated as ev(G)) is a measure of the degree to which a module contains unstructured constructs. Unstructured constructs decrease the quality of the code and increase the effort required to maintain the code and break it into separate modules. Therefore, when essential complexity is high, there is a high number of unstructured constructs, so modularization and maintenance is difficult. In fact, during maintenance, fixing a bug in one section often introduces an error elsewhere in the code.
It is expressed as a proportion of complexity and is calculated by the examination of flowgraphs where constructs which are either in sequence (for example 2 if statements one after the other) or parallel (for example cases in switch statements) are ignored, leaving those which have overlapping scope. Essential complexity is the complexity of the reduced flowgraph.
You can find out more about essential complexity in the NIST special report here.
> Back to Top
Eventmap:
A McCabe IQ instrumentation architecture in which all events ( branches) are uniquely numbered starting at 1. The event numbers are inserted directly into the instrumented source and will be written out as trace data when the instrumented application is executed. There are two types of Eventmap instrumentation which are Full Path (where every event is always written) and Branchonly (where events are only written once per execution).
> Back to Top
Exclude:
This is the process of changing or reducing the information displayed in the Battlemap according to a set of rules (also known as an "Exclude"). The exclusion is controlled by the Exclude Tool ( Tools->Exclude in the Battlemap), which allows the creation of a series of "rules" to be applied to the full structure chart. Rules use the "verbs" root, depth, omit, stub, connect or articulate with arguments to define the exclusion to be applied.
> Back to Top
Export:
This is the process of creating instrumented source code once parsing is complete. McCabe Test copies instrumented source into the specified INSTDIR location, and also usually creates an additional McCabe instrumentation source file which needs to be added to the instrumented application when it is compiled to write trace data.The terminology diagram displays the McCabe analysis process.
> Back to Top
Flowgraph:
The graphical representation of the logic in a module. It comprises edges and nodes with the nodes numbered sequentially and (optionally) included on the flowgraph. A flowgraph is usually displayed alongside the Annotated Source Listing.
> Back to Top
Functional View:
The Battlemap can display two diagrams showing different information which are the Functional View and the Class View.
The Functional View is the diagram shown by default, and it displays modules as boxes. Lines in the Functional View represent calls between modules. Modules are colored green, yellow or red (default colors which can be changed) according to a customizable box coloring scheme.
The calling lines in the Functional View represent the three different possible types of calls which are unconditional, conditional and iterative (called many times); different colors and/or symbols can be used for each line type. Lines shown to the left are performed earlier than lines on the right.
> Back to Top
Global:
This term is used to describe the scope of data elements and modules which are not defined locally (and can therefore be accessed anywhere in executable code).
It is also used to describe Custom Reports, Custom Metrics and Derived Metrics which are stored in the McCabe Repository and which are available in all McCabe Projects.
> Back to Top
Halstead:
Maurice H. Halstead derived a series of metrics (Elements of Software Science, Operating, and Programming Systems Series Volume 7. New York, NY: Elsevier, 1977) to measure a program module's complexity directly from source code, with emphasis on computational complexity.
There are 8 metrics in the range, calculated from 4 scalar numbers derived directly from a program's source code (total and unique operators and total and unique operands).
> Back to Top
Hostid:
The hostid is the unique identifier used by McCabe to create a license file. It is actually the MAC hardware address of the network adapter installed in your machine and is usually an 8 or 12 digit number.
Note that your machine may have more than one hostid if you have more than one network adapter installed. In this case you should supply all hostids to McCabe.
> Back to Top
Import:
The process of reading trace data created by an instrumented application into the matching McCabe Program/ Project.The terminology diagram displays the McCabe analysis process.
> Back to Top
Inline:
This is a directive used in C and C++ to indicate that a function ( module in McCabe IQ) should be expanded wherever it is used, rather than "called" as a separate piece of code. The inline directive is in fact just a request to do this, as there are rules used by the compiler to determine whether an inline function will in fact be expanded.
> Back to Top
Instrumentation:
The process of inserting trace statements into source code, which when compiled will write trace data. The terminology diagram displays the McCabe analysis process.
> Back to Top
Instrumentation Library:
This is the additional source file (usually) created by McCabe IQ when source code is instrumented. This source file contains the instructions to capture and write trace data which is created by the instrumented source. These files are different for each instrumentation architecture, and dependent upon the architecture used may be generated uniquely for each McCabe program.
The instrumentation library can be modified according to your requirements. You can either change standard settings to alter the behavior of instrumentation (for example to overwrite trace files rather than append), or wider changes can be made to cause trace data to be written to a different location. The supplied instrumentation libraries have been tested under supported environments, but it is impossible to guarantee their operation in every environment - consequently they represent examples of how instrumentation could be performed, and are designed to be modified for your specific requirements.
> Back to Top
Instrumented Source:
Source code which has had trace statements inserted automatically, which when compiled will write trace data.
> Back to Top
Integration Complexity:
Integration Complexity (abbreviated as iv(G)) is a measure of a module's decision structure as it relates to calls to other modules. This quantifies the testing effort of a module with respect to integration with subordinate modules. Software with high integration complexity tends to have a high degree of control coupling, which makes it difficult to isolate, maintain, and reuse individual software components.
It is also known as Module Design Complexity .
It is expressed as a proportion of complexity and is calculated by the examination of flowgraphs where branches which do not call other modules are ignored, leaving those which do perform calls. Integration complexity is the complexity of the reduced flowgraph.
> Back to Top
Kiviat:
A Kiviat diagram is circular in shape and is used to display more than 2 metrics as evenly spaced lines radiating from the origin in the form of "spokes". Each metric line has the minimum, average and maximum values marked. Connecting lines are drawn from each minimum point to create a polygon, and this is repeated for the average and maximum points. The diagram provides a powerful graphical representation of total metrics values for a Project.
> Back to Top
Level: McCabe IQ supports several levels at which metrics are collected which are module, class or program. Metrics at one level are calculated at higher levels with the default collection technique being to use average values. You can specify alternate collection techniques when you create new Derived Metrics including average, sum, minimum and maximum.
> Back to Top
License Manager:
McCabe IQ uses a FlexLM Floating License Manager. You may install McCabe IQ on as many workstations as you wish, and the License Manager will ensure that only the number of concurrent sessions for which you are licensed will be allowed to start. Beyond that number, users will receive an appropriate error message and the tools will not start.
Licenses are freed immediately (there is no persistence), meaning that you can get optimal usage from your concurrent licenses. The License Manager can be installed on any supported platform, and will provide licenses to any other platform (dependent upon the platforms for which you are licensed).
Access to the License Manager can be controlled, for example reserving specific licenses to specified users or groups of users, or allowing access for specified groups at specified times. More details about how to administer and configure the License Manager can be found in the FlexLM Users Manual.
> Back to Top
Linked Object:
This is the output from the link process where compiled objects created by compiling source code are combined together to create executables, and other final linked objects.
Linked objects are usually libraries or archives.
> Back to Top
Linking:
The process of combining together the object code created by compiling source code. Source code is usually located in more than one file, and a compiler typically converts separate source files into object code in separate files. In order to create a single executable program or object, the separate object files need to be combined together.
> Back to Top
Local:
This term is used to describe the scope of data elements and modules which are defined inside a module (and can therefore only be accessed within this module).
It is also used to describe Custom Reports, Custom Metrics and Derived Metrics which are only created in a single McCabe Project and can therefore only be accessed there (as opposed to global metrics and reports).
> Back to Top
Make:
A build utility available on several platforms which uses a makefile to compile and link source code to create the final executable application.
> Back to Top
Make2pcf:
McCabe utility to convert make files into a McCabe project. It can either use a makefile as input (it will then run make on this file to extract a make log), or alternatively it can point at an existing make log.
The utility contains a list of hard-coded compilers and file extensions (dependent upon platform) which it uses to understand a makelog; extra combinations of compilers and file extensions can be administered using AUTO_PCF_TAG entries in the config.scf file.
> Back to Top
Makefile:
A configuration file used by the make utility defining the location of source files, how they will be compiled and linked to create the executable program.
The make2pcf utility can be used to create McCabe projects from makefiles (provided they are of a supported format).
> Back to Top
Member Function:
A code element within a class. Member functions can be defined as public, private or protected which defines access level and inheritance properties.
> Back to Top
Method:
Another name for a member function in a class.
> Back to Top
Modified Condition Decision Coverage:
This is a type of coverage analysis, where the outcomes of compound decisions containing more than one predicate are analyzed logically to ensure that all possible combinations have been executed. McCabe IQ supports MC/DC analysis; you need to use the Boolean instrumentation architecture to store this coverage information. MC/DC is required as part of the US Department of Defense standard DO-178B.
> Back to Top
Module:
A language dependent element of source code, displayed in the Battlemap. In C, a module equates to a function, in C++ and Java it is a function or a member function, and in VB, Ada and FORTRAN it is a procedure or function. In COBOL, a module equates to a SECTION, or under certain circumstances to a PARAGRAPH.
> Back to Top
Module Design Complexity:
Another name for Integration Complexity.
> Back to Top
Node:
Numbered elements in a flowgraph, connected by at least one edge. Nodes are displayed in the Annotated Source Listing, but do not directly equate to line numbers in the source code (there can be several nodes for each line of source). Nodes are inserted into a flowgraph for several reasons including:
- Module entry
- Data element usage
- Call to another module
- Inflow from more than one branch
- Module exit
Parser configuration will change how nodes are assigned (for example Node Compression will cause sequential non-calling nodes to be removed, and Data analysis will cause data nodes to be created).
The actual number of nodes has no relation to complexity metrics, as adding or removing nodes does not alter the overall flow and structure of a flowgraph.
> Back to Top
Object Code:
This is the machine executable code created when source code is compiled. In some environments, the object code may need to be linked to create an executable program.
> Back to Top
Object Oriented: A software system written using classes in an object oriented language to implement a software solution. Each class is used as a framework to instantiate an instance of a class, known as an object. Classes contain member functions and member data.
Object oriented metrics measure the nature of classes in terms of size, data usage, encapsulation, coupling and cohesion. McCabe IQ measures the range of OO metrics proposed by Chidamber and Kemerer at the 1994 Object Symposium, and now accepted as industry standard.
> Back to Top
Parse:
The process of analyzing a McCabe Program. Source code in each source file is analyzed in turn, with the results being combined at the end of the run to create Battlemaps, metrics reports etc. The terminology diagram displays the McCabe analysis process.
> Back to Top
Parse Tag:
These are strings used in PCF files to determine which parser will be used to analyze source code. Parse tags in PCFs are cross-referenced with the PARSE entries in the config.scf file located in McCabe\7.1\bin (Windows) or McCabe/7.1/bin (Unix). These entries define the parser executable to be used, whether the parse is static or dynamic and other parse options which may be applied.
Note that parse options can be supplied in both the PCF file and the config.scf file and are appended before being passed to the parser.
The Config Wizard uses special parse tags (usually starting with the string "cw_") which do not apply options in the config.scf , ensuring that options are always stored in the PCF. In this way, it is possible to modify parser options using the Config Wizard without changing the contents of the config.scf file. If the Config Wizard is invoked on an existing project which uses parse tags with options defined in the config.scf, it will convert the format of the PCF to use "cw_" parse tags and place all parse options in the PCF.
> Back to Top
Pathvec:
A McCabe IQ instrumentation architecture which uses sophisticated buffering and caching to store coverage information. Pathvec instrumentation is the default for most languages, and is suitable for most environments and testing processes. Pathvec should not be used on embedded platforms (where performance is important), where there is no local filesystem, or where the tests are expected to continue for a long time.
> Back to Top
PCF:
Project Configuration File - the file which defines the contents of a McCabe Project. The file must contain at least one Program, which in turn must contain at least one parse tag defining source files to be analyzed
The McCabe IQ database is created in the same location as the PCF when the project is parsed.
> Back to Top
Predicate:
A single decision within a compound decision. Consider the code extract:
if ((a=1) and (b=1))
In this case both (a=1) and (b=1) are predicates, and the whole if statement is a compound decision.
> Back to Top
Preprocess:
This is the process, required in some languages, of expanding "include" files before compilation.
C and C++ typically use preprocessing, where included files and macro definitions are inserted into the source before the compiler starts to compile the source. McCabe parsers also need to see the preprocessed source to perform an accurate analysis.
Therefore in some languages, dependent upon how you create the Project and the parse options you supply (usually the -NPP flag indicates that no preprocessing is required), a preprocessor may be called during the parse process. Other languages which can use preprocessing include COBOL, Fortran and VB.
The terminology diagram displays the McCabe analysis process.
> Back to Top
Program:
A container inside an IQ Project defining the source files to be analyzed at the same time. Each Project must contain at least one Program. You may only view one Program at a time in the Battlemap, but may switch between Programs in the current Project, and create new Programs as required.
Programs in a Project are written to the same PCF, and are indicated using the PROGRAM keyword. Each Program contains at least one source file which is specified using a parse tag.
Some metrics are collected at this level (i.e. program-wide metrics and average or sum values for modules and classes in the project).
> Back to Top
Project:
A McCabe IQ .pcf file containing one or more McCabe Programs and the associated temporary support files which comprise it. All files reside in the folder where the .pcf exists. Default location for projects created in Config Wizard is beneath McCabe\7.1\projects (Windows) or McCabe/7.1/projects (Unix).
> Back to Top
Purge:
The process of cleaning the temporary files from a McCabe Project, leaving only the configuration and support files. Thereafter, if you open the Project, the source files will need to be reanalyzed and a parse will be performed.The terminology diagram displays the McCabe analysis process.
> Back to Top
Reparse:
The process of reanalyzing one or more source files if they have changed, or if the Project settings have changed. The Battlemap and CLI automatically check the date stamps of files in a Program each time they operate. If a source file is more recent than the last time it was analyzed, or if the parse options have changed since the last parse, then the file is reparsed. The results from reparsing files and from previously parsed files are then combined to create a modified Battlemap. The terminology diagram displays the McCabe analysis process.
> Back to Top
Repository:
The McCabe Repository is the central location used in McCabe IQ to store global reports, global derived metrics, QA snapshots, TEST test data, COMPARE snapshots and all central information.
Whenever a user creates a global report, stores a QA snapshot (Quality->Snapshots in the Battlemap) or performs any operation which stores information centrally, the data will be written into the McCabe Repository.
By default, the McCabe Repository is located where the tools are installed in the folder McCabe\7.1\repos (Windows) or McCabe/7.1/repos (Unix). You can create a repository in any location, and multiple users can access the same repository provided they have read and write access to it. The Repository is actually a series of folders with ASCII files, and no server process or program is required to service it.
> Back to Top
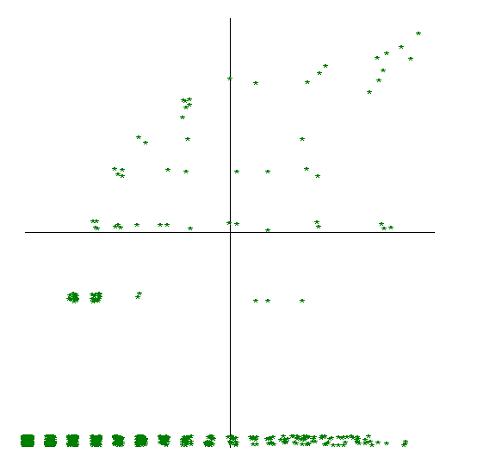
Scatterplot:
This is a 2-axis "cross-hair" diagram where one metric is plotted horizontally, and the other is plotted vertically. The axes are logarithmic with the extreme top and right being infinity and the extreme bottom and left being zero. The central "cross-hair" represents the threshold values for each metric. The standard Scatterplot is accessed using Metrics->Graphical->Scatterplot in the Battlemap, and by default this diagram shows cyclomatic complexity versus essential complexity with thresholds of 10 and 4 respectively.
You can modify the threshold values and the metrics displayed in the standard Scatterplot (using Preferences->Metrics Settings ) and create your own Custom Reports including Scatterplots.
Example Scatterplot
> Back to Top
Snapshot:
A "snapshot" of metrics stored in the Repository using Quality->Metric Snapshots in the Battlemap. You must be licensed for McCabe QA to store snapshots.
Snapshots can be used to create trend reports.
> Back to Top
Source Code:
The textual code listing which conforms to language specifications which is compiled into object code by a compiler, stored in source files. McCabe IQ parses source code to create metrics, structure charts, flowgraphs etc., and will also create a copy of instrumented source for compilation and testing to create coverage information.
> Back to Top
Static:
Static analysis is the process of parsing source code to create reports, views and metrics which can be displayed in the Battlemap.
Static metrics are those calculated directly from source code, and not related to coverage.
> Back to Top
Syntax Errors:
These are reported by a compiler during compilation of source code when a sequence is encountered which does not conform to the expected rules. The compilation process usually terminates immediately.
McCabe parsers can also report syntax errors when parsing source code and an unexpected sequence is encountered, however, unlike a compiler, the parse process will continue and the parser will attempt to work past the error. Consequently, syntax errors can be ignored provided the reason why the parser is reporting errors is understood and the impact is limited.
> Back to Top
Template:
A C++ function, member function or class which allows the creation of generic functions that admit any data type as parameters and return value without having to overload the function with all the possible data types. They are analogous in certain ways to macros.
> Back to Top
Thread/Thread-Safe:
Some execution environments allow the code from a single program to be executed in separate processing streams called threads. Using threads will optimize the performance by ensuring that slow parts of an application can be run in parallel to other activities. Thread-safe means that instrumentation will store the trace results from more than one thread without corrupting the results. If the instrumentation architecture is not thread-safe, then trace results from separate threads may be interspersed, creating corrupt trace data.
> Back to Top
Threshold:
The value of a metric above which an element is of interest. Typically, below a threshold, metrics do not correlate with real effects, and code elements below threshold usually do not require to be code reviewed or modified.
> Back to Top
Trace Data:
Data stored by an instrumented application when it is executed. Trace data can be stored in a trace file, sent to the Coverage Server or stored in other ways. Trace data needs to be imported into the project which exported the instrumented source.
> Back to Top
Trace File:
The file written by an instrumented application (or by the Coverage Server which is collecting information from the same) to store coverage information.The terminology diagram displays the McCabe analysis process.
> Back to Top
Trend:
A report created from more than one metrics snapshot stored in the McCabe Repository. You must be licensed for McCabe QA to create and view metrics trend reports.
McCabe Analysis and Project Terminology
> Back to Top
|